Institutional performance analytics and professional reporting software built for hedge funds, family offices, emerging managers, and investment teams.
Windows desktopLocal data storageExcel · PDF · Word
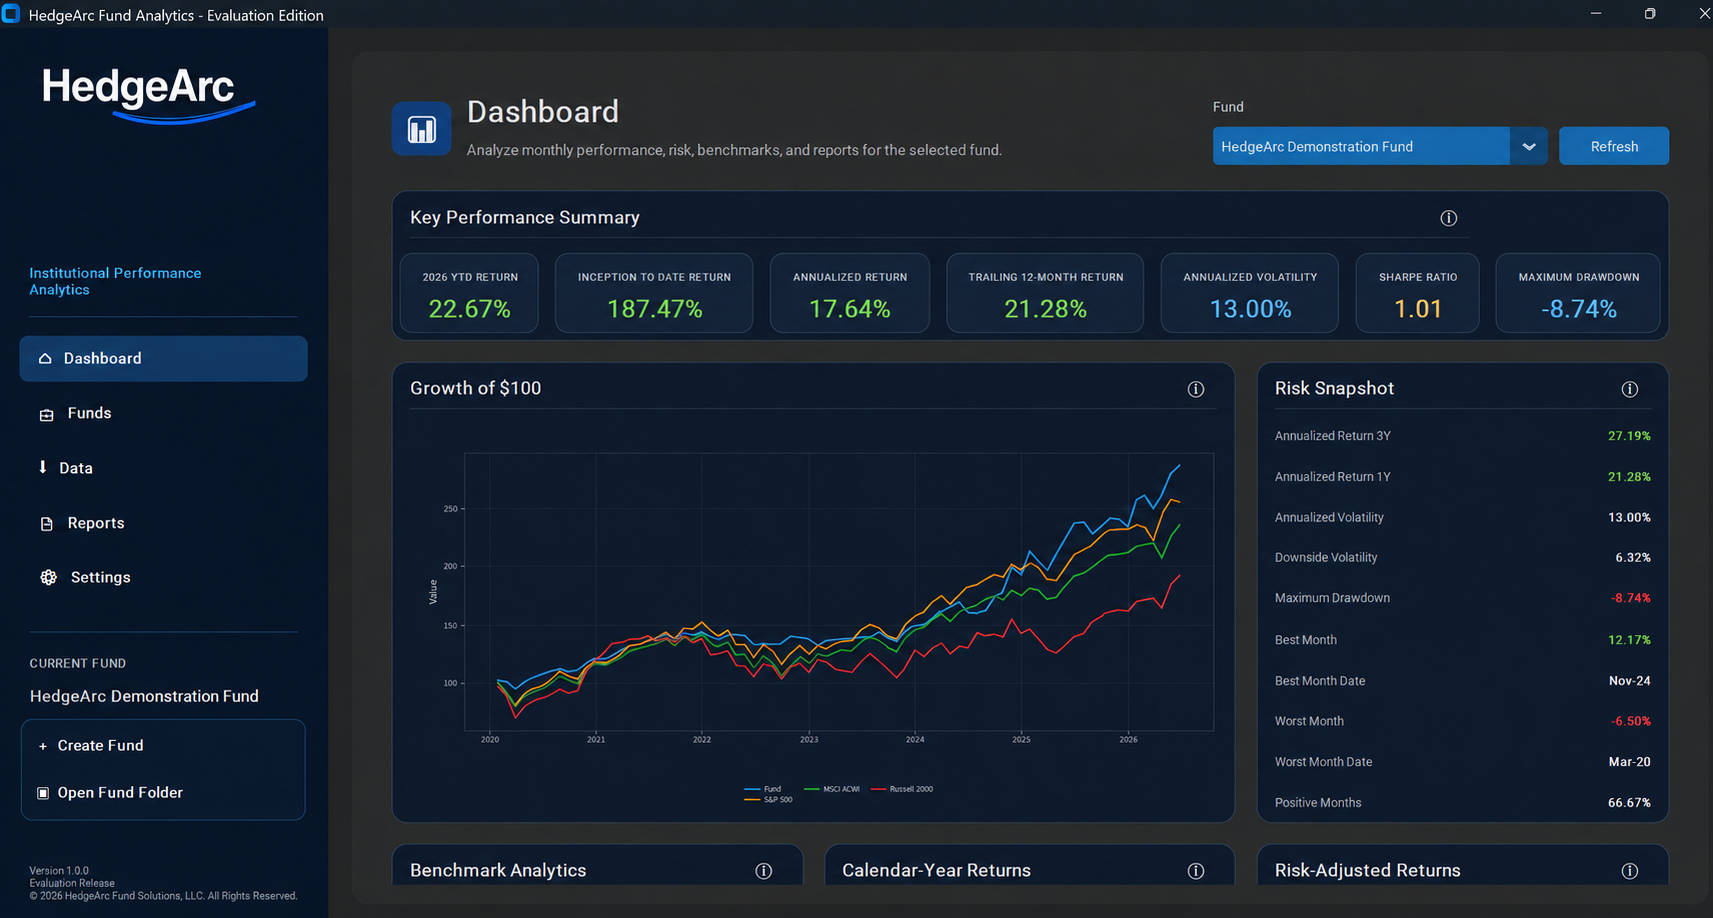
HedgeArc Fund AnalyticsPerformance dashboard
17.64% Annualized return1.01 Sharpe ratio
Built for investment professionals
From monthly returns to a complete analytical picture.
Replace fragmented spreadsheets and manual report preparation with a focused workflow built around the way investment managers evaluate performance.
01
Institutional analytics
Move beyond headline performance with a structured view of returns, risk, drawdowns, consistency, and benchmark-relative results.
Return and calendar-year analysis
Risk and distribution measures
Capture, alpha, beta, and correlation
Rolling analytics and visualizations
02
Professional reporting
Generate presentation-ready deliverables from the same return history, benchmark selections, and analytical assumptions.
Multi-tab Excel analytics workbook
Multi-page PDF performance tear sheet
Editable Word report
Definitions and allocator interpretations
03
Optional AI commentary
Add narrative interpretation using an OpenAI API key supplied and controlled by the user.
Concise, standard, or detailed styles
Commentary embedded in reports
Optional and user controlled
Separate OpenAI API billing
Who can benefit?
Professional analytics for managers at every stage.
Turn a monthly return history into a structured analytical package that is easier to evaluate, explain, and present.
01
Emerging managers
Present a prior track record in an institutional format using the performance, risk, drawdown, and benchmark analytics allocators expect to review.
Build a professional package before launch
Support allocator conversations
Move beyond a basic return table
02
Existing managers
Maintain direct control of fund return data and refresh the same analytical views through a local desktop application.
Keep performance data on the firm’s computer
Standardize recurring reporting
Generate outputs without another portal
A dashboard with depth
Move from headline returns to risk, consistency, and benchmark context.
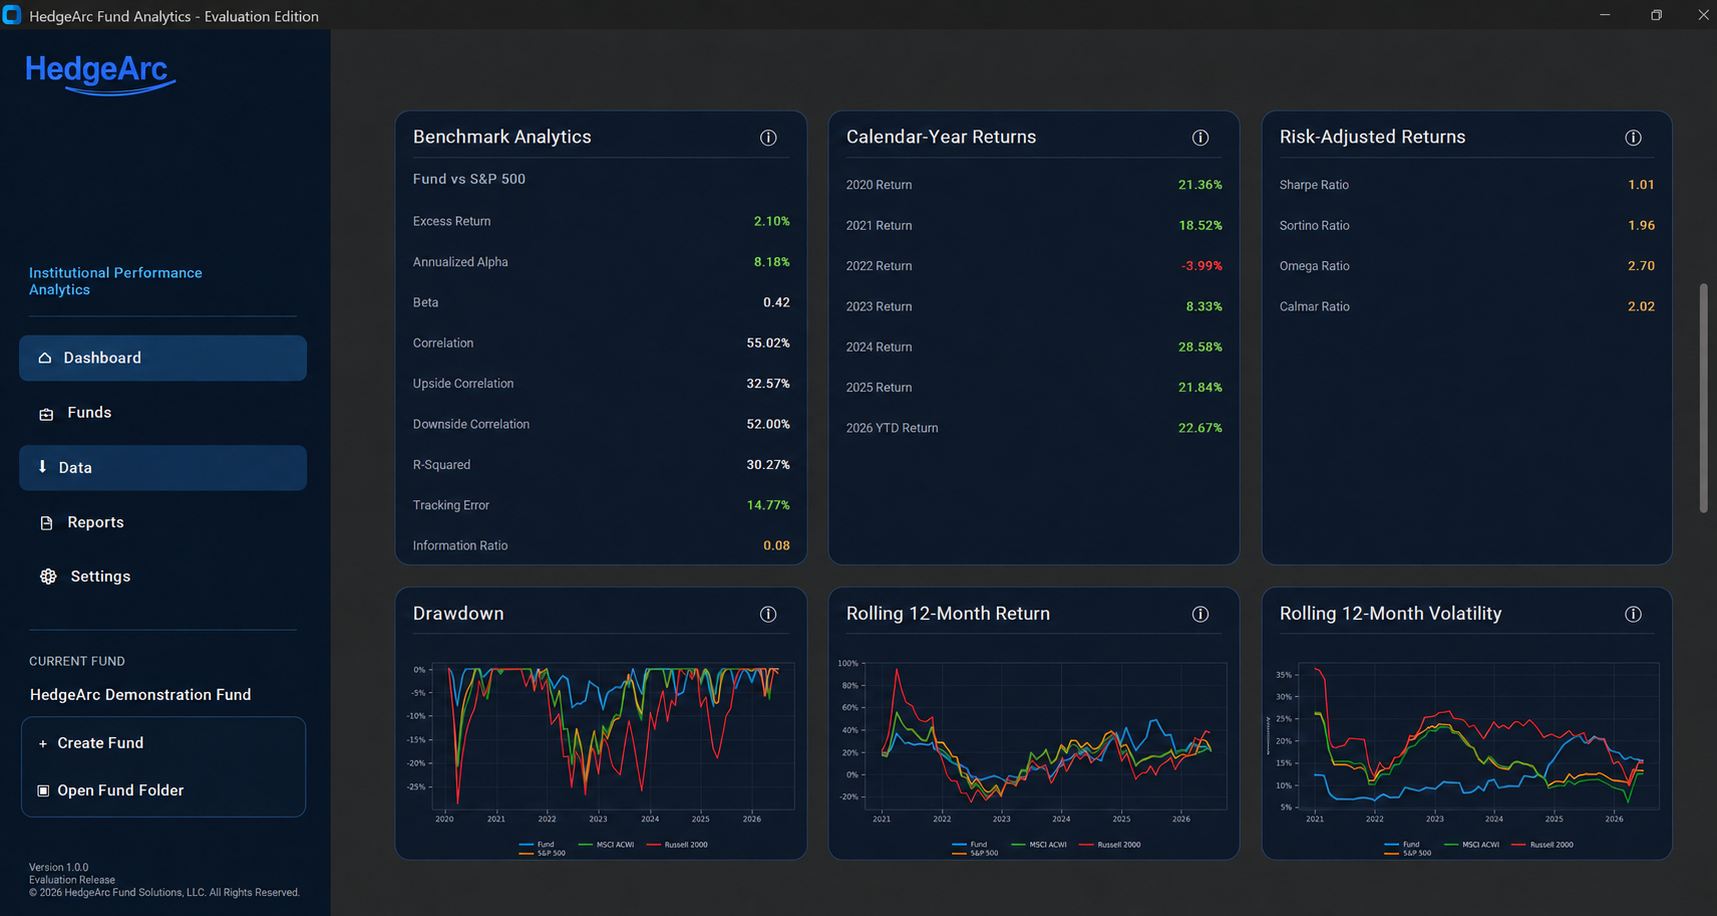
Review growth, drawdowns, rolling returns, volatility, capture ratios, alpha, beta, correlation, risk-adjusted returns, and calendar-year performance in one interface.
Benchmark, drawdown, and rolling analytics remain visible in one review workflow.
Complete analytics library
Every calculation, organized and ready to explain.
Review fund results independently and relative to selected benchmarks, with definitions and interpretations available throughout the application and its reports.
Returns & timing
Annualized and inception-to-date returns
Trailing one- and three-year returns
Calendar-year returns
Best and worst months
Positive and negative months
Risk & distribution
Annualized and downside volatility
Maximum drawdown and recovery
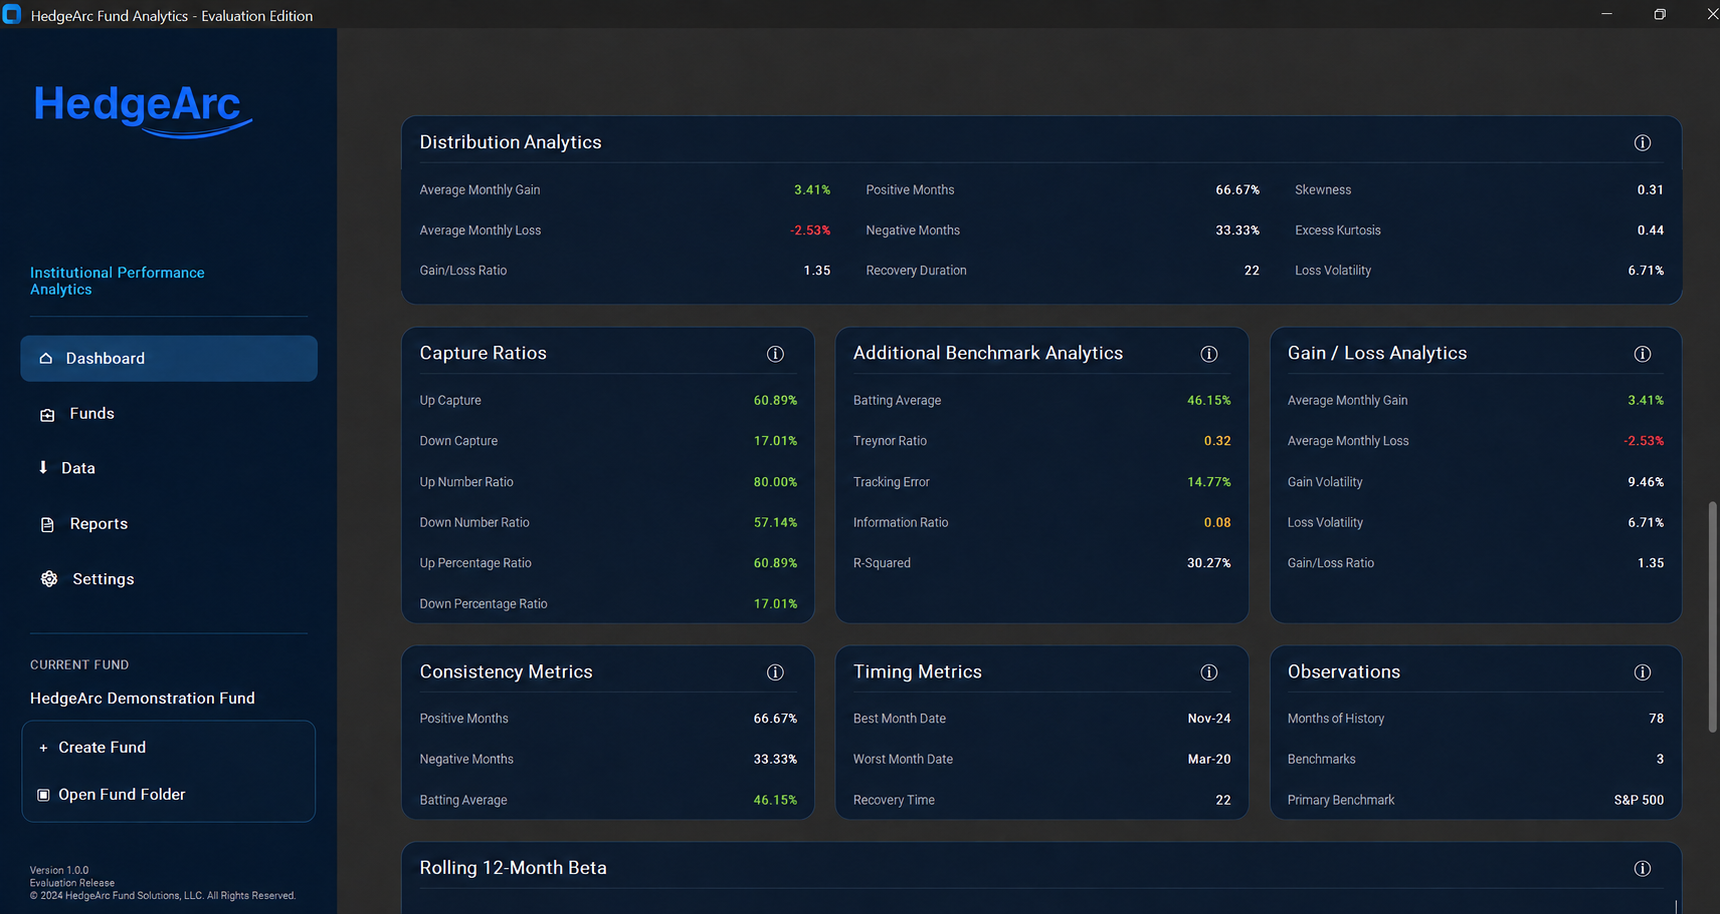
Skewness and excess kurtosis
Average monthly gain and loss
Gain/loss ratio
Risk-adjusted analytics
Sharpe ratio
Sortino ratio
Omega ratio
Calmar ratio
Treynor ratio
Benchmark analytics
Alpha, beta, and R-squared
Correlation and tracking error
Information ratio and batting average
Upside and downside capture
Up and down number ratios
Charts & visual analysis
Growth of investment
Drawdown history
Monthly return heatmaps
Rolling returns, volatility, and beta
Return distribution histogram
Distribution, capture, consistency, timing, and benchmark calculations are organized into reviewable panels.
AI commentary available
Add narrative commentary to analytical results.
Users may enable AI commentary in generated reports and choose a concise, standard, or detailed style. The feature is entirely optional and uses the user’s own OpenAI API key.
Reporting without reconstruction
One dataset. Three professional deliverables.
Generate an Excel analytics workbook, a multi-page PDF tear sheet, and an editable Word report from the same performance history and assumptions.
X
Excel Analytics
Detailed workbook with analytical tables, heatmaps, and charts.
P
PDF Tear Sheet
Presentation-ready performance reporting.
W
Word Report
Editable analytics, commentary, and definitions.
Straightforward pricing
Institutional analytics without institutional software pricing.
A focused desktop platform for investment managers who want deeper analytics and professional outputs without another complex enterprise system. When used as part of a HedgeArc middle- or back-office engagement, the software is included at no additional software charge while HedgeArc is engaged; an annual license applies if the client elects to retain it after transition.
HedgeArc Fund Analytics runs as a Windows desktop application. Fund return data and generated reports remain on the user’s computer. Optional AI commentary is enabled only with an API key supplied and controlled by the user.